


SOPAC helps survey every well in Nauru
Between March and April 2010 SOPAC and the Government of Nauru conducted a survey of every well in Nauru to determine water quality, usage, and possible areas of contamination.
Nauru has no significant surface water resources, limited groundwater resources, and is extremely vulnerable to drought. Water for domestic use comes from a mixture of desalinated water delivered by truck, rainwater harvested from roofs, non-potable coastal groundwater, seawater and limited use of the thin freshwater lens found under Nauru’s central plateau.
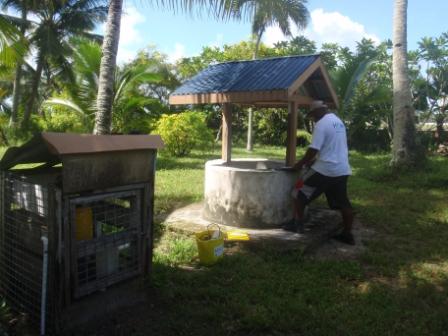
Two locally based teams surveyed 336 wells by going house to house over 5 weeks. 30% of Nauru’s population rely on water from domestic wells for bathing, washing, general cleaning, and toilet flushing.
Shallow groundwater from wells is susceptible to contamination and results from 275 bacteriological samples taken during the survey indicate that 50% have E coli readings of over 100MPN/100ml. This suggests that sewage from septic tanks is the most likely cause of contamination.
The survey was taken after a period of good rains, when access to rainwater was readily available. With this in mind data collected on usage suggests that 236 kilolitres (KL) to 402KL, or an average of 100 litres per person per day by those using groundwater, are taken from shallow wells daily. Rainwater was estimated to account for 62% of the water used in Nauru, with groundwater and desalinated water calculated at 22% and 16% respectively. During droughts, when rain water is scarce, the figures for groundwater and desalinated water will increase as more people rely on groundwater
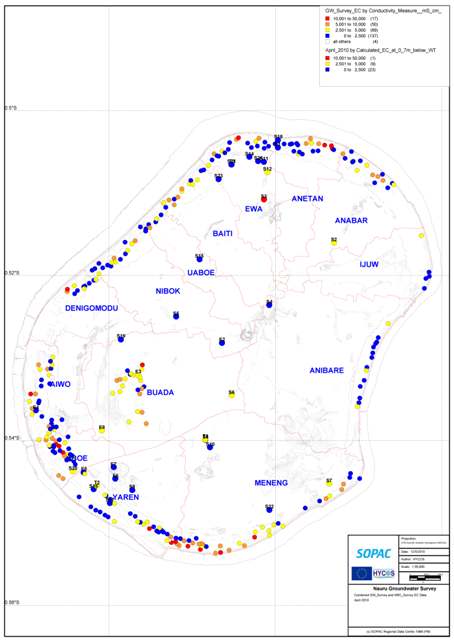
Maps on water quality were constructed using salinity data collected during the survey. These maps show where groundwater is fresher as well as the variability of groundwater quality that can be expected in regards to both time and location. (For a pdf of this map click here).
This information is available as GIS data developed for Nauru which includes other information such as rainwater harvesting. The development of this water resource data will support future water resource management decisions and ultimately help improve water access and security for the people of Nauru.
SOPAC coordinated funding from different projects to allow the survey to be undertaken. Donors included the European Union, AusAID, and the Government of Nauru with technical support provided by staff at SOPAC and the Government of Nauru.
SOPAC gratefully acknowledges the support and generosity provided by the people of Nauru in allowing the survey to be undertaken.
Please Click below to download the Salinity map mentioned in the above story.
_____________________________________________________________________________________________________________________________________________________
Peter Sinclair SOPAC Hydrogeologist - +679 338 1377.
Please Click below to download the Salinity map mentioned in the above story.
_____________________________________________________________________________________________________________________________________________________
Peter Sinclair SOPAC Hydrogeologist - +679 338 1377.

