GEOSCIENCE DIVISION
Map Cook Islands Federated Sates of Micronesia Fiji Kiribati Nauru Niue Papua New Guinea Republic of Marshall Islands Republic of Palau Samoa Solomon Islands Tonga Tuvalu Vanuatu
Country
Population
Land Area
Climate
Water resource
Water consumption
Country Cook Islands Cook Islands
Population 21,750 (July 2007 est.)
Land Area 236.7 km2
Climate
Water resource
Water consumption
Country Federated Sates of Micronesia Federated Sates of Micronesia
Population 107,862 (July 2007 est.)
Land Area 702 km2
Climate
Water resource Avg Rainfall: 4,928 mm per annum
Water consumption
Country Fiji Fiji
Population 918 675 (July 2007 est.)
Land Area 18,270 km2
Climate
Water resource Avg Rainfall: 2000 - 3000 mm per annum
Water consumption
Country Kiribati Kiribati
Population 107,817 (July 2007 est.)
Land Area 811 km2
Climate
Water resource Avg Rainfall: South of the equator: 1,300 mm Tarawa: 2,000 mm Northernmost islands: over 3,200mm Eastern Line Islands: less than 1,000 mm
Water consumption
Country Nauru Nauru
Population 11,528 (July 2007 est.)
Land Area 21 km2
Climate
Water resource Avg Rainfall: 2,090 mm per annum
Water consumption
Country Niue Niue
Population 1,625m(GoN statistics 2006)
Land Area 260 km2
Climate
Water resource Avg Rainfall: 2,180 mm per annum
Water consumption
Country Papua New Guinea Papua New Guinea
Population 5,795,887 (July 2007 est.)
Land Area 462,840 km2
Climate
Water resource Avg Rainfall:1000-80000 mm per annum
Water consumption
Country Republic of Marshall Islands Republic of Marshall Islands
Population 20,842
Land Area 458 km2
Climate
Water resource Avg Rainfall: 3,700 mm per annum
Water consumption
Country Republic of Palau Republic of Palau
Population 61,815(July 2007 est.)
Land Area 11,854.3 km2
Climate
Water resource Avg Rainfall: Southern attols: 4,000mm Northern attols:2,000 mm per annum
Water consumption
Country Samoa Samoa
Population 214,265
Land Area 2,944 km2
Climate
Water resource Avg Rainfall: 3,000 mm per annum
Water consumption
Country Solomon Islands Solomon Islands
Population 566,842
Land Area 28,450 km2
Climate
Water resource Avg Rainfall:1500-5000 mm per annum
Water consumption
Country Tonga Tonga
Population 116,921
Land Area 748 km2
Climate
Water resource Avg Rainfall: Varies from north and south of tonga with an estimated average of 2500 mm per annum
Water consumption
Country Tuvalu Tuvalu
Population 11.992 (July 2007 est.)
Land Area 26 km2
Climate
Water resource Avg Rainfall: 3000mm per annum
Water consumption
Country Vanuatu Vanuatu
Population 211,971 (July 2007 est.)
Land Area 12,200 km2
Climate
Water resource Avg Rainfall: 2000 - 4000 mm per annum
Water consumption
Theme
Key Message
Action
Project Title
Implementing Agency
Partnership Organisation
Location
Status
Donor Agency
Keywords
("," separated)
Cancel
Click here to add a new record to the Pacific Water Action Matrix.
View the map for more country information.
Papua New Guinea
Geography
Total Area 462,840 km2
Land 452,860 km2
Water 9,980 km2
Highest Elevation 4,509 m

Land Use
Arable 0.49%
Perm. Crop 1.4%
Other 98.11% (2005)

People
Population 5,795,887 (July 2007 est.)
Population Growth Rate 2.163% (July 2007 est.)

Economy
GDP per capita (PPP) $2,700 (2006 est.)

Water Statistics
Avg Rainfall  1,000 - 8,000 mm per annum
   
Papua New Guinea


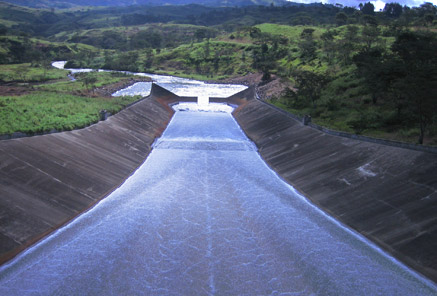
Status of Water Resources

The following are some water resources in PNG that can be harvested for economic and domestic use.
  • Surface fresh water from streams, rivers, lakes, ponds, reservoirs, estuaries and swamps;
  • Subsurface freshwater from confined and unconfined aquifers;
  • Surface and subsurface brackish water showing varying degrees of salinity; and
  • Effluent water, which can be treated and recycled.


Problems with Water Resources and Associated Environment Issues

The overriding challenge in most situations is to deliver water at the right quantity and quality for a given use. In rural PNG, only 20% of the population have access to an improved water supply which includes public standpipes, boreholes, protected wells or springs. For the rest of the population, water is directly taken from the source. In the urban areas which PNG Waterboard services, 91% have access to treated and reticulated water but only 60% of these households get piped water directly into their houses.

While the water resources available in a catchment is initially subject to natural climatic and geophysical conditions, various land uses and waste disposal linked to population growth is also affecting the capacity to supply in terms of quantity and quality to cater for ranges of water uses.

Currently, there are few catchments that are directly accessible to the main urban towns and cities in PNG. The development of these sources to sustain the demand is difficult with settlers settling in critical areas like at headwaters causing concern for pollution to the original source etc. Landuses such as agriculture, cultivating crops that consume more water deprives other users to benefit from the same source. Catchments such as Laloki (proposed demonstration site), Wahgi and Bumbu are over stressed with poor quality yields and high demand from various users.

Additionally, there no proper catchment management plans that would dictate the landuse type in the area and equally distribute water resources. The constant increase in population has pushed communities and settlements to move into catchments that could not support different agricultural landuses causing stress to environment and water resources. Clearing of riverbanks are causing increasing erosion and depositing them into waterways.

The other main concern is to develop a policy to regulate activities within critical catchments and provide for equal distribution of the resources to all users.

Diagnostic Report

Demonstration Proposal
Hot Spot Analysis

Information on this page obtained from Integrated Water Resources Management programme's Diagnostic Reports (SOPAC 2007)