Four methods of real loss management
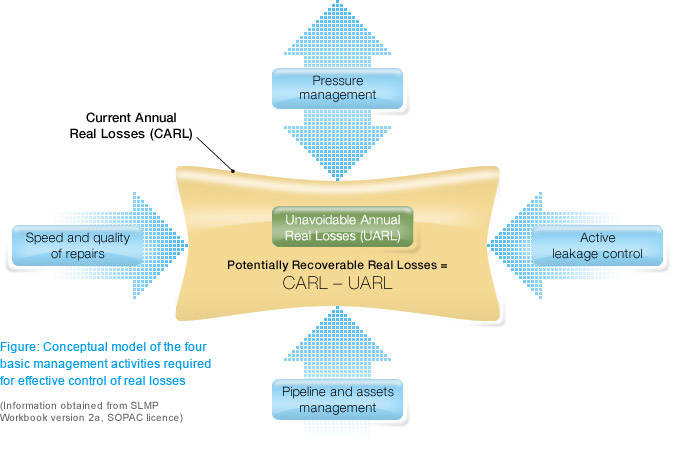
The four basic management activities required for effective control of real losses
(International Water Association water loss task force)
A key component of a water balance and a System Loss Management Plan (SLMP) is the Infrastructure Leakage Index (ILI). The ILI provides guidance as to how well real losses are being managed (in terms of repairs, active leakage control and infrastructure management) at the current operating pressure. The following explains the four basic management activities required for effective control of real losses.

Real Losses consist of leakage and overflows from transmission and distribution systems up to the point of customer metering or consumption. The adjacent diagram summarizes the 'best practice' principles of managing real losses (Squeezing the Box theory).
Suppose the large yellow box in the figure represents the Current Annual volume of Real Losses (CARL) for a system, calculated from a standard IWA annual water balance. Real Losses tend to increase as systems grow older, but can be kept in check by an appropriate combination of all four of the leakage management activities shown as block arrows:
* Speed and quality of repairs: to minimise the run-time of all leaks and breaks
* Pressure management: to reduce the numbers of new breaks and all leak flow rates
* Active leakage control: to find and fix unreported leaks and breaks
* Pipeline and assets management: selection, installation, maintenance, renewal, replacement
It is not possible to completely eliminate Real Losses. The green box represents the lowest technically achievable Real Losses, or 'Unavoidable Annual Real Losses' (UARL), for well managed systems with reasonably good infrastructure. The UARL can be calculated on a system-specific basis, as a volume per day or year, based on mains length, number of service connections, customer meter location (relative to property line) and average pressure.
The difference in volume between the Current Annual Real Losses (CARL: yellow box) and the Unavoidable Annual Real Losses (UARL: green box) represents the Potentially Recoverable Real Losses. The ratio of CARL/UARL is known as the Infrastructure Leakage Index (ILI). The Economic Level of Real Losses usually lies somewhere between the CARL and the UARL.


