GEOSCIENCE DIVISION
Map Cook Islands Federated Sates of Micronesia Fiji Kiribati Nauru Niue Papua New Guinea Republic of Marshall Islands Republic of Palau Samoa Solomon Islands Tonga Tuvalu Vanuatu
Country
Population
Land Area
Climate
Water resource
Water consumption
Country Cook Islands Cook Islands
Population 21,750 (July 2007 est.)
Land Area 236.7 km2
Climate
Water resource
Water consumption
Country Federated Sates of Micronesia Federated Sates of Micronesia
Population 107,862 (July 2007 est.)
Land Area 702 km2
Climate
Water resource Avg Rainfall: 4,928 mm per annum
Water consumption
Country Fiji Fiji
Population 918 675 (July 2007 est.)
Land Area 18,270 km2
Climate
Water resource Avg Rainfall: 2000 - 3000 mm per annum
Water consumption
Country Kiribati Kiribati
Population 107,817 (July 2007 est.)
Land Area 811 km2
Climate
Water resource Avg Rainfall: South of the equator: 1,300 mm Tarawa: 2,000 mm Northernmost islands: over 3,200mm Eastern Line Islands: less than 1,000 mm
Water consumption
Country Nauru Nauru
Population 11,528 (July 2007 est.)
Land Area 21 km2
Climate
Water resource Avg Rainfall: 2,090 mm per annum
Water consumption
Country Niue Niue
Population 1,625m(GoN statistics 2006)
Land Area 260 km2
Climate
Water resource Avg Rainfall: 2,180 mm per annum
Water consumption
Country Papua New Guinea Papua New Guinea
Population 5,795,887 (July 2007 est.)
Land Area 462,840 km2
Climate
Water resource Avg Rainfall:1000-80000 mm per annum
Water consumption
Country Republic of Marshall Islands Republic of Marshall Islands
Population 20,842
Land Area 458 km2
Climate
Water resource Avg Rainfall: 3,700 mm per annum
Water consumption
Country Republic of Palau Republic of Palau
Population 61,815(July 2007 est.)
Land Area 11,854.3 km2
Climate
Water resource Avg Rainfall: Southern attols: 4,000mm Northern attols:2,000 mm per annum
Water consumption
Country Samoa Samoa
Population 214,265
Land Area 2,944 km2
Climate
Water resource Avg Rainfall: 3,000 mm per annum
Water consumption
Country Solomon Islands Solomon Islands
Population 566,842
Land Area 28,450 km2
Climate
Water resource Avg Rainfall:1500-5000 mm per annum
Water consumption
Country Tonga Tonga
Population 116,921
Land Area 748 km2
Climate
Water resource Avg Rainfall: Varies from north and south of tonga with an estimated average of 2500 mm per annum
Water consumption
Country Tuvalu Tuvalu
Population 11.992 (July 2007 est.)
Land Area 26 km2
Climate
Water resource Avg Rainfall: 3000mm per annum
Water consumption
Country Vanuatu Vanuatu
Population 211,971 (July 2007 est.)
Land Area 12,200 km2
Climate
Water resource Avg Rainfall: 2000 - 4000 mm per annum
Water consumption
Theme
Key Message
Action
Project Title
Implementing Agency
Partnership Organisation
Location
Status
Donor Agency
Keywords
("," separated)
Cancel
Click here to add a new record to the Pacific Water Action Matrix.
View the map for more country information.
Country Level Implementation- Republic of the Marshall Islands

Republic of the Marshall Islands (RMI) 

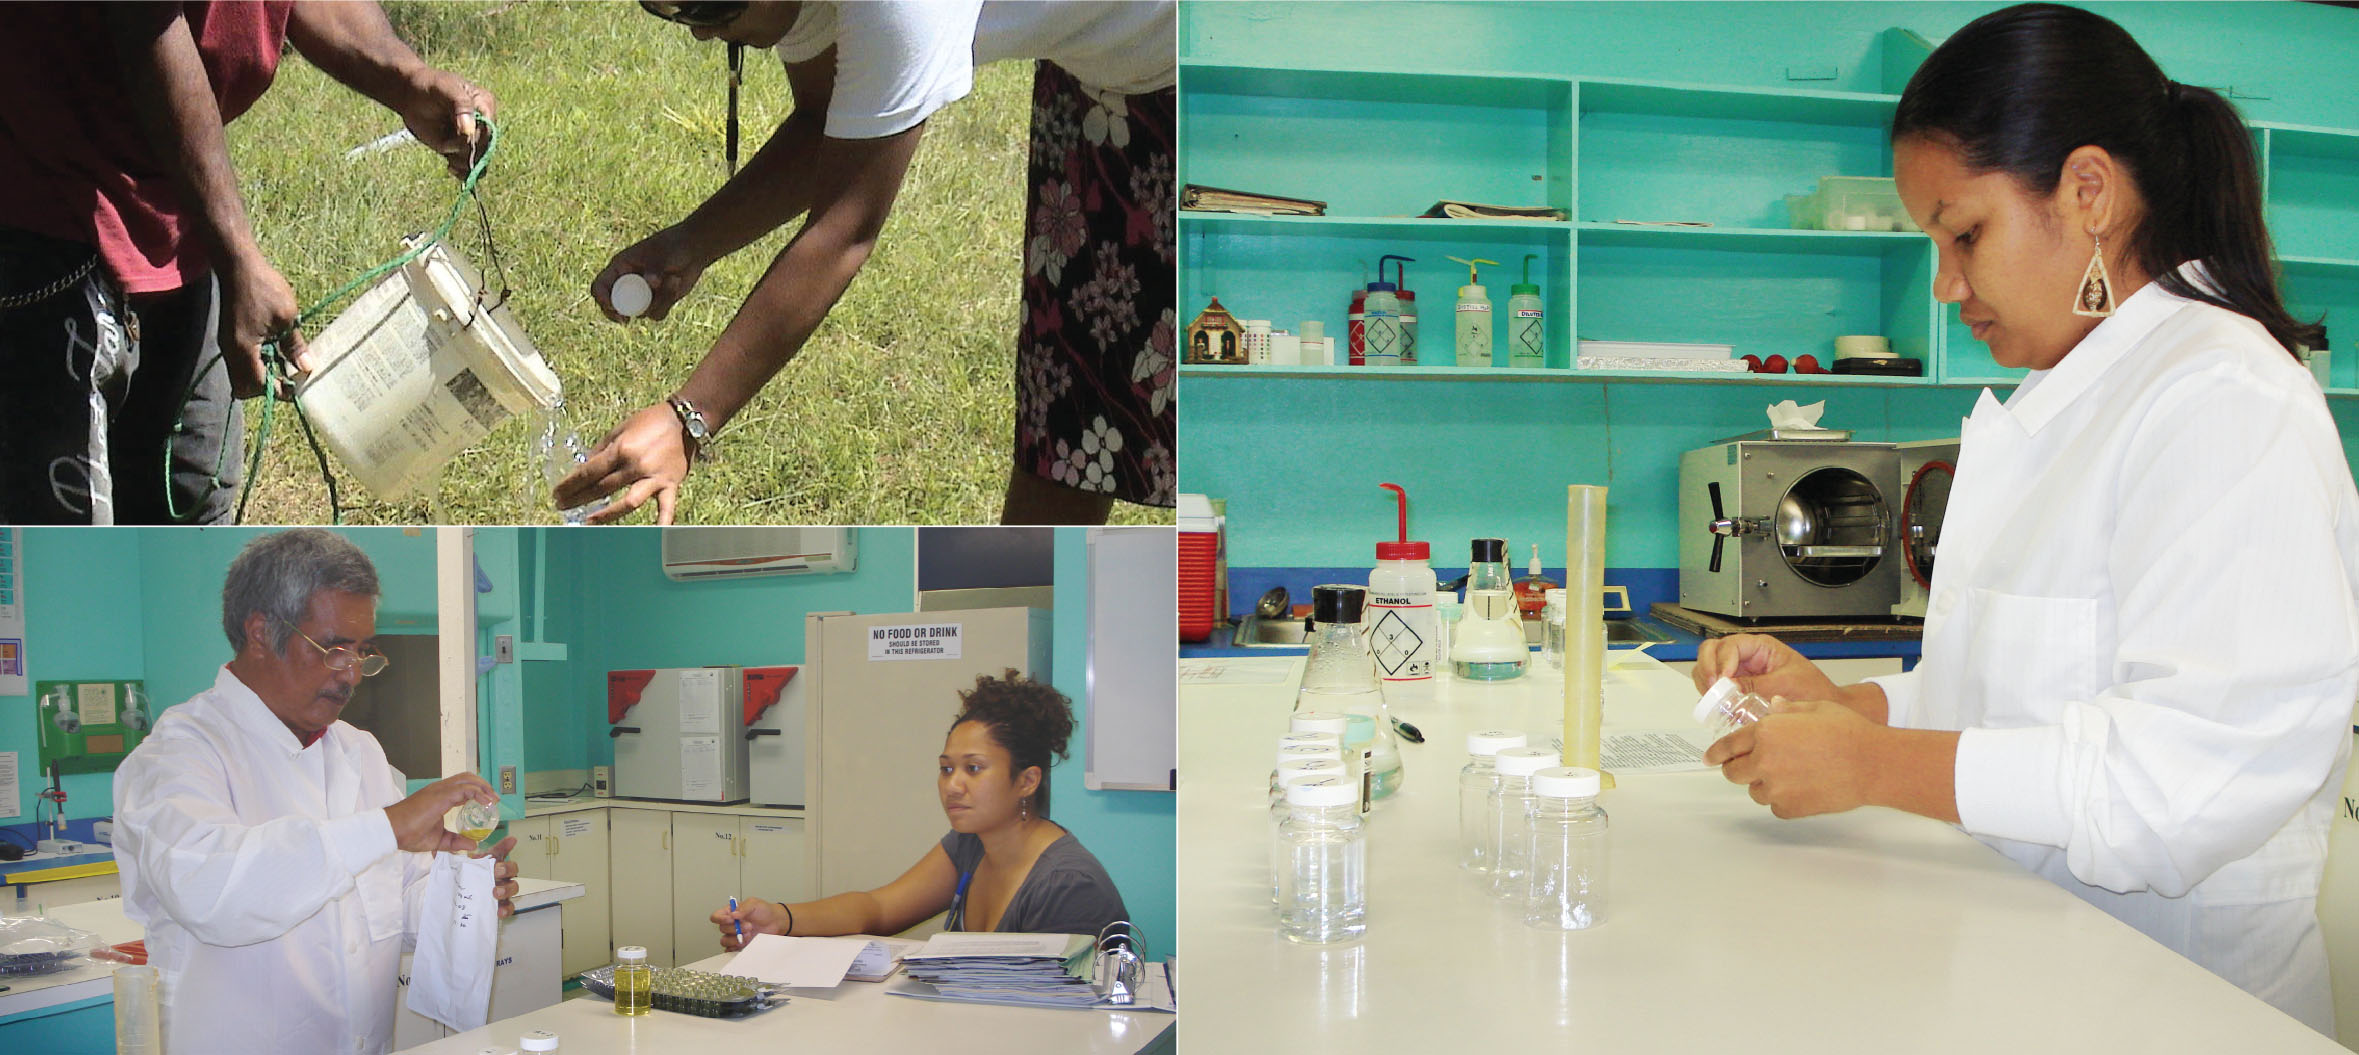
Three capacity building missions (December 2007, March 2008 and November 2008) have been carried out in RMI after the initial scoping and assessment visit in August 2006. Training during these missions were on proper water sample collection and testing techniques, setting up quality assurance and quality control procedures (QA/QC), assisting with standard operating procedures (SOPs), use of the hydrogen sulfide (PathoScreen) water test kits and result interpretation. These have assisted the Majuro EPA laboratory strengthen and improve their water quality monitoring role. 
In March 2008, the US EPA certification (voluntary) team performed an audit of the RMI EPA water laboratory and certified both the laboratory and technicians for Colilert and Enterolert testing in drinking water and coastal waters respectively. This was a great milestone for the WQM. The template below was designed to show baseline capacity of participating country laboratories and indicate progress of  WQM implementation. The RMI EPA Majuro water laboratory improved from rating as around satisfactory in 2006 (initial assessment) to near good in 2008. 
 

Key features

Ideal lab

RMI EPA Majuro Water Laboratory  

Aug 2006

Mar 2008

April 2010

1. Proper lab space

3

2

3

3

2. QA/QC in place

3

1

2.5

2.5

3. Instruments being calibrated

3

0

2

2

4. Basic equipment present

3

2

3

3

5. Reagent supply

3

3

3

3

6. Staff knowledge/training

3

2

3

3

7. Analysis SOPs

3

0

3

3

8. Sample traceability (log-in)

3

2

3

3

9. Data storage

3

2

2

2.5

10. Funding

3

3

3

3

Total

30

17

27.5

28

Score:                         Poor-0                        Fair- 1             Satisfactory- 2                       Good- 3

The commitment from both the laboratory technicians and the management has been outstanding and they have made good use of the assistance provided under WQM to advance their water quality monitoring. Further support is being provided to assist strengthen the laboratory’s chemical testing capacity and data management.